Charged Journeys: Exploring the Electric Vehicle Revolution
UX Research

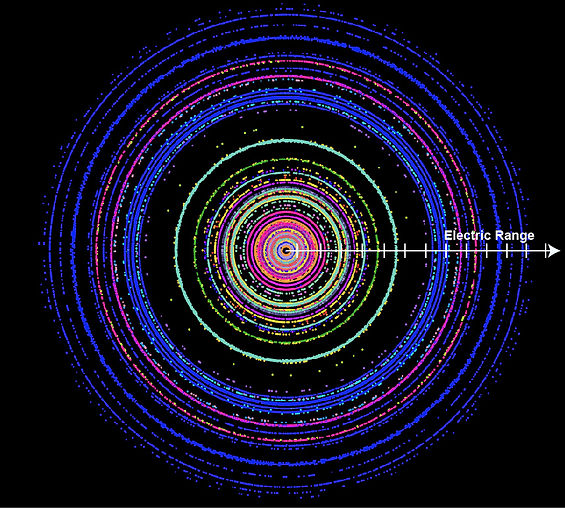
As users hover over individual dots, a wealth of information is revealed within a white translucent box. This information includes details such as the make and model of the vehicle, its electric range, and the location where it is registered. This interactive feature allows users to delve deeper into specific data points, gaining insights into the diverse array of electric vehicles present across various regions in the US.
The visualization is designed to be both informative and engaging, offering users a visually stimulating experience as they explore the electric vehicle landscape. By leveraging the power of data visualization, “Charged Journeys” aims to shed light on the growing prominence of electric vehicles and their role in shaping the future of transportation towards sustainability.
Some Other Projects
Eventsza
Eventsza is a digital marketplace that connects users with event vendors worldwide, making event planning effortless and accessible.
DZA
DZA Legal, a distinguished law firm, required a digital presence that reflected its expertise, professionalism, and commitment to providing legal services with integrity.
Northeastern University Sustainability Hub
The sustainable management of universities is key for ensuring clean air, water, food, and soil in local ecosystems, supporting the growth of all life and biodiversity
Dynamics of Workshop Facilitation
This is an ongoing research that delves into the multifaceted role of card deck games in facilitation,
Salus Populi (Live)
Salus Populi is a judicial education program at Northeastern University aimed at educating the judiciary
Data Campaign: We Deserve Better
The “We Deserve Better” data campaign draws inspiration from the vibrant and bold works of artist and designer Yinka Ilori, known for his colorful and engaging designs.
Crime Rate in United States
The dataset on crimes in various cities of the United States over the last 35 years has been analyzed and visualized using different layers,
GreeneGene
The dataset on crimes in various cities of the United States over the last 35 years has been analyzed and visualized using different layers,
Charged Journeys: Exploring the Electric Vehicle Revolution
Powered by JavaScript’s p5.js library, this dynamic data visualization unveils insights from a publicly available dataset on electric vehicles in the United States.